Environmental monitoring
The ICTS-Doñana carries out samplings in accordance with protocols of environmental and biodiversity data, from the record of physical-chemical variables to estimates of abundance and distribution of species and communities.
These protocols generate time series that allow analyzing the evolution of the conservation status of Doñana, and the detection of changes in ecosystems (appearance of invasive species, diseases and pests, the decline of populations or the progressive desiccation of wetlands) and are a fundamental tool to take management measures that minimize the impact of local and global change, and favor the conservation of this unique natural space.
The information collected is published in our annual reports and is integrated into international networks such as LTER-Europe and LifeWatch.
MONITORING
Abiotic Environment
Physical and chemical factors that influence and affect living beings and are the support of ecosystems and biodiversity.
Meteorology
Analogical meteorological station located close to the Doñana Palace with daily data (8:30 a.m. approx.) of maximum/minimum temperature and precipitation (measured in totalizing rain gauge) from November 1978 to present. Meteorological stations allowing automated real-time recording of hydrological and meteorological variables at different END points.
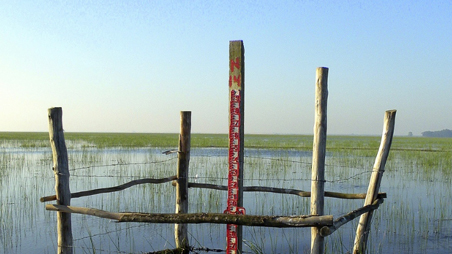
Hydrodynamics
Monitoring temporal and spatial flooding dynamics in Doñana wetlands, marshes and temporary lagoons. From flooded surface and hydroperiod derived from satellite images, to water level, temperature and quality monitoring in automated hydrometeorological stations, and specific measurements of physical-chemical characteristics, depth, and limnimetric scale readings in an extensive network of points.
Sedimentation, dune dynamics and coastline changes
Evolution of dune dynamics (advance speed of dune trains), marsh sedimentation and coastline changes, using remote sensing-based protocols.
Flora and Vegetation
Richness of plant species as well as spatial distribution, structure, composition and abundance of plant communities.
Flora
Flora of interest due to uniqueness or threat, and monitoring of invasive flora species to assess invasion progress and effectiveness of control/eradication measures. Cataloguing and monitoring status of singular trees
Vegetation
Various sampling techniques monitor long-term conservation status and evolution of Doñana's vegetation, including species composition changes, vegetation structure and disturbance responses. Using periodic sampling, plot monitoring and remote sensing.
- Terrestrial vegetation cover
- Juniper and pine-juniper woodland
- Scrubland
- Gallery forest
- Cork oak and aviary
- Land use changes in PND surroundings
- Habitats of Community Interest (HIC)
- Phenocameras
Fauna
Various samplings and monitoring to track Doñana's native fauna and its temporal and spatial dynamics.
Understanding community organization and habitat disturbance responses over time. Also monitoring invasive species presence, distribution, abundance and impacts on local biodiversity.
- Image
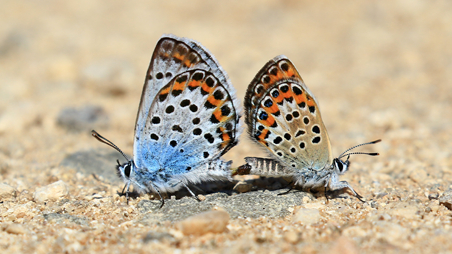
Macroinvertebrates- Terrestrial invertebrates: Special monitoring of Butterflies (Butterfly Monitoring Scheme) and Argentine ant (Linepithema humile)
- Aquatic invertebrates: Passive trap sampling
- Image
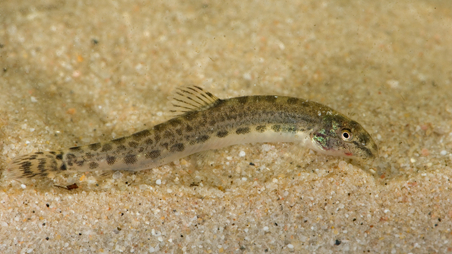
Fish
Using passive traps (nets)
- Image
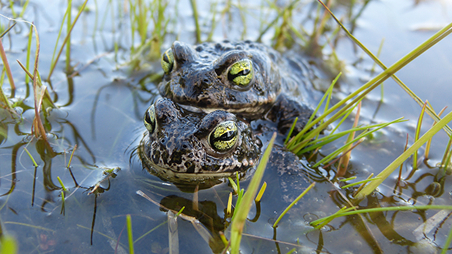
Amphibians
Using passive traps, netting, visual surveys and acoustic surveys
- Image
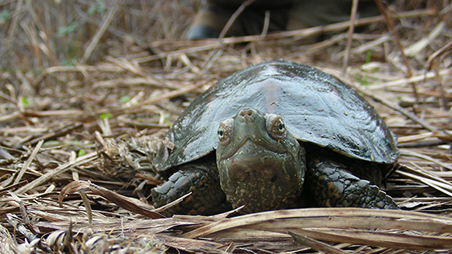
Reptiles
- Turtles: Moorish tortoise through footprint censuses and intensive sampling. Native terrapins via passive traps
- Lizards and geckos: Transect censuses and artificial shelter checks for elusive reptiles
- Image
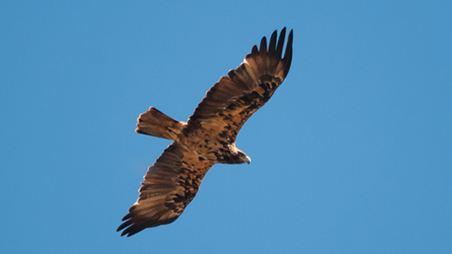
Birds
Most extensively monitored group through multiple protocols: monthly aerial waterbird counts from light aircraft, ground waterbird censuses, linear transects (motor vehicle, horseback, foot) or fixed sampling points, and bird banding.
- Waterbirds: Aerial, ground and breeding censuses
- Coastal birds: Ground censuses
- Raptors: Censuses of threatened/scarce breeding birds and winter roosts
- Ground censuses for common breeding (SACRE Protocol) and wintering birds (SACIN Protocol)
- Postnuptial migrant monitoring: Constant effort ringing station
- Red-legged partridge: Vehicle-based linear transects
- Image

Mammals
- Herbivores and carnivores: Linear transects for individual and track censuses
- Micromammals: Capture plots and artificial shelters
- Image
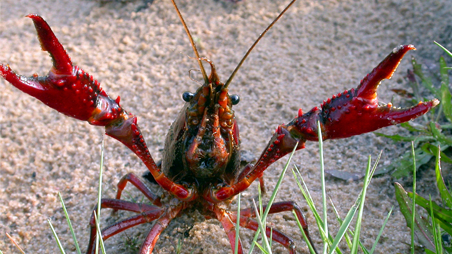
Invasive Alien Species
Special attention to invasive species using same techniques as for native taxa
Monitoring Methodologies
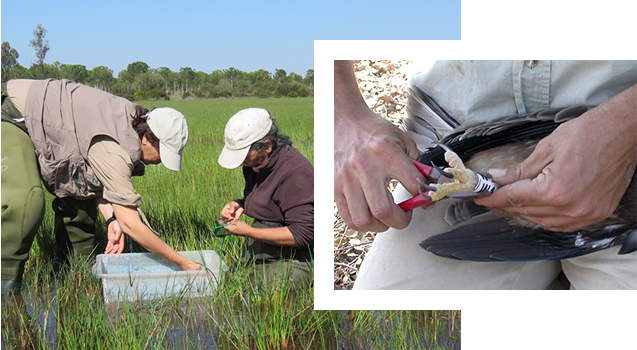
Manual
Most monitoring protocols require specialized technicians for censuses, sampling or banding
They deploy/retrieve capture gear, identify species, collect water/sediment/vegetation samples, and conduct lab analyses
Automatic
Network of automated stations with sensors providing real-time environmental monitoring data with high temporal resolution
Continuous testing of automated monitoring pilots like passive acoustic sampling
Eddy Covariance Towers
Measure carbon, water and energy exchanges between vegetation and atmosphere. Determine if ecosystems are carbon sinks/sources
Hydrometeorological Stations (HydroMet)
Measure meteorological variables, incident/reflected radiation, plus water level, temperature and quality in marsh/temporary lagoon points
Ecophysiology Enclosure
Sensorized juniper plot measuring precipitation (including horizontal), plant growth, meteorological variables and photosynthetic activity
Webcams
Real-time windows to Doñana's fauna, flora and landscapes. Custom thumbnail for each camera
Phenocams
Record vegetation photosynthetic activity and track temporal changes (phenology)
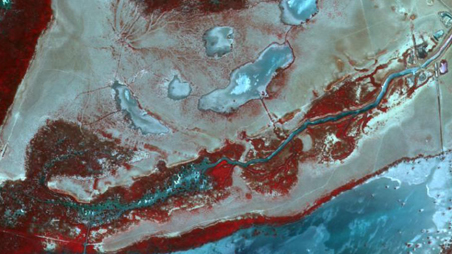
Remote Sensing
Satellite images provide complete electromagnetic radiation data from Doñana's ecosystems
Used to determine flooded areas, vegetation productivity and coastline changes. Landsat images track marsh flooding (since 1986), temporary lagoons and artificial water bodies
- Image

Flooded SurfaceCalculated from cloud-free Landsat images (30m pixel resolution, 8-16 day acquisition cycle)
- Image
Hydroperiod
Days of pixel inundation calculated from hydrological cycle flood images
- Image

Coastline
5-year coastline reconstruction using Landsat images at same tide level, calculating advance/retreat speeds
- Image
Marsh Sedimentation
5-year calculation of new sand deposits using Landsat images in stream mouths (Partido, Soto Grande, Soto Chico)
- Image
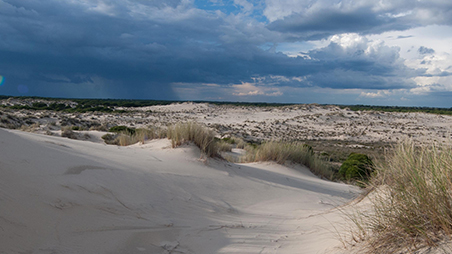
Dune Dynamics
5-year calculation of dune train front/tail positions using Landsat images, generating advance speed maps
- Image

Vegetation/Land Use Changes
5-year updates using Andalusian LULC maps for surroundings, plus protected area vegetation change analysis